이번에는 "netstumbler"라는 무선AP 스캔 소프트웨어를 통해 나의 무선AP가 현재 어떤 상태에서 작동되고 있는지를
알아보고, ap기의 상태를 종합적으로 판단, 좀 더 나은 통화품질 상태를 유지하기 위해 본 자료를 등록합니다.
1. netstumbler란?
1) 공식 웹사이트 : http://www.netstumbler.com
2) 주변에 검색되는 모든 무선AP기를 스캔하는 무료 소트트웨어
3) 공개된 무선AP기와 비공개된 무선AP기를 구분 출력 해주며, 공개된 무선AP기는 무선노트북이나 단말기로 접속
인터넷 사용, 또는 myLG070 통화용도로 사용가능.
4) 각각 무선AP기의 상세정보(속도, 사용채널, 출력값.....)를 볼수 있음
2. 설치
1) 우선 본문내 첨부파일로 등록된 해당 프로그램을 설치 합니다.
2) 무선랜카드가 있는 컴퓨터나 노트북에서 무선랜 카드를 활성화 합니다.
3) 설치 후 Scaning 버튼을 클릭합니다.
3. 화면 이해와 ap기 성능 확인
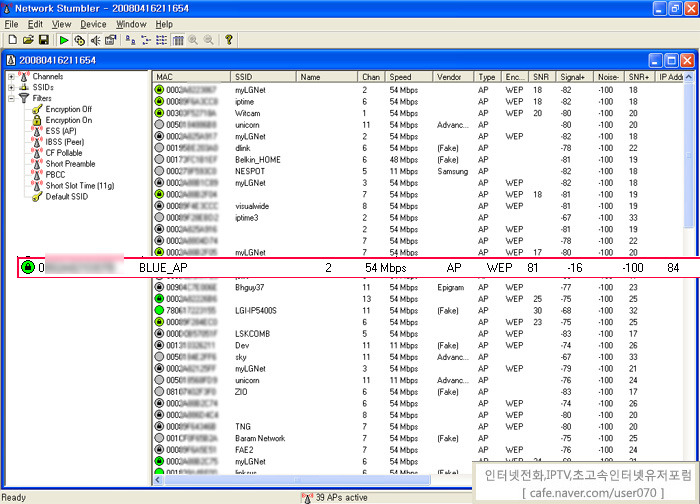
1) 스캐닝된 상태 화면입니다. 저의 주변에는 무수한 ap기들이 보입니다. 대략 40~50개(^^;;)정도 무선ap기가 검색되는군요
각 무선 AP별 맥주소, SSID명, 사용채널과 보안상태, SNR값등 여러 정보들이 나옵니다.
* AP기의 맥주소로 자신의 AP기를 식별하기 어려운 경우 SSID명을 변경 하셔서 본 프로그램을 구동하면 좀 더 쉽게
자신의 AP기를 식별 할 수 있습니다. (SSID명 변경 하는 방법 바로가기 : http://cafe.naver.com/user070/2962)
2) 아래 리스트를 보시면 SSID(myLGNET)으로 검색되는것은 모두 myLG070 전용AP기입니다.
이미지 중간의 "BLUE_AP" 는 저의 전용ap기의 ssid명을 변경한 것 입니다.
3) 현재 제가 사용하고 있는 myLG070 전용AP기의 상세정보 입니다.
-. 녹색열쇠표시는 신호강도와 보안여부를 나타내고 있습니다.
-. 색상별 신호강도 세기는 녹색(아주좋음) > 주황 > 노랑 > 회색(접속 안됨) 순입니다.
-. 색상이 주황~노랑이라면 필수적으로 ap기 점검을 받아보셔야 합니다.
-.맥주소와 myLGNET의 SSID를 BLUE_AP로 변경했고 무선채널은 2번 채널, 속도와 보안(WEP),SNR 값,노이즈 등의
값을 볼 수 있습니다.
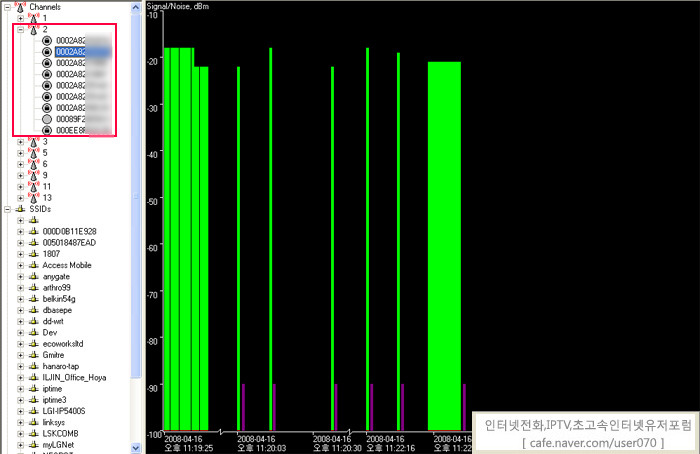
4) 위 3)에서 보시면 현재 저의 ap기는 채널 2번을 사용하고 있습니다. 아래그림 좌측에서 채널2번을 선택합니다.
저의 ap기 주변에 같은 채널을 사용하는 무선ap기의 리스트입니다.
전용AP기는 고유한 채널을 이용해서 단말기와 송수신을 하게 됩니다. 이 채널이 만일 주변의 무선AP와 중복해서
사용 하게 되면 그만큼 무선랜의 데이터전달 속도가 떨어지거나 불안정하게 됩니다. 이러한 영향으로 무선인터넷
속도가 떨어진다거나 단말기의 통화품질이 나빠지거나 밧데리소모시간이 빨라지기도 합니다.
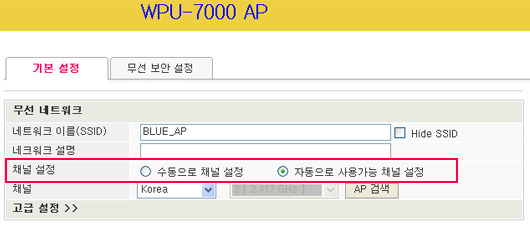
물론 전용AP기는 옵션으로 자동으로 최적의 채널을 탐색해서 변경할 수 있도록 기본옵션이 제공됩니다(아래그림
참조) 만 통화품질이 떨어지거나 단말기 밧데리 소모량이 과다하게 빨리 닳는 경우는 본 소프트웨어로 채널검색을
해보고 동일 채널에 무선ap기 수를 비교하여 가장 적은 채널로 전용ap기 채널을 수동으로 설정해줍니다.


[그래프 이해]
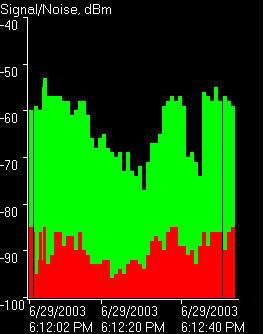
1) 녹색바는 신호세기를 나타냅니다. 바의 길이가 높을수록 (-10으로 갈수록) 일단은 좋습니다.
일반적으로 -80이하로 바의 길이가 짧아지면 단말기 통화가 거의 불가능하고 ap기 점검을 받으시거나 원인을 별도로 찾아
보셔야 합니다.
2) 빨강색바는 잡음율(noise)레벨을 나타냅니다. 바의 길이가 짧을 수록 잡음이 덜합니다.
3) 녹색바(신호세기)와 빨간색(잡음) 바의 차이를 S/N or SNR (signal-to-noise ratio) 신호 대 잡음비입니다.
위 두번째 이미지를 보시면 참고로 저는 snr 값이 82로 측정되었네요.
snr은 보통 데시벨이라는 단위가 사용되며, 쉽게 말씀드리면 ap기에서 신호를 보낼때 단말기에서 수신된 신호에 잡음이
얼마나 섞여 있는가 를 표시한 것이라 보시면 될 것 같습니다. 통상 20데시벨 이상(snr 값이 20이상) 차이가 나야지만
신호를 청취 할 수 있다고 합니다.
종로거리 한가운데에서 친구가 크게 저에게 말합니다. 친구의 목소리의 세기는 녹색바이고 종로거리 주변의 잡음은 빨간색
입니다. 친구가 목소리를 크게해도( 신호세기가 클지라도 ) 종로거리 자체에 다른 잡음이 많다면 저에게는 잘 들리지 않습
니다. 즉 SNR 값이 작습니다.
친구목소리가 적더라도 주변이 조용한 극장(주변 잡음이 없다면) 저에게는 잘 들립니다. 즉 SNR 값이 큽니다.
이처럼 신호세기와 잡음은 서로 상관 관계가 있습니다.
결론적으로 측정된 SNR 값이 클수록 좋다는, 선명하고 또렷하기 단말기에서 들린다는 얘기를 드리고 싶어서 장황하게
설명드렸습니다.
장장 이틀간의 지지부진했던 팁 등록을 마칩니다.
저 역시 관련 분야의 전문가가 아닌지라 혹 내용전달이나 기타 오류를 발견하시면 주저 마시고
덧글로 기재해주시면 본문에 수정 첨가 하도록 하겠습니다.
---------------------------------------------------------------------
[ 부록 netstumbler 도움말 첨부 ]
[Graph View ]
The data that appears in the graph view is somewhat dependent on your hardware and device driver.
- The green bars indicate signal strength. The higher the bar, the better the signal.
- The red bars, if available, indicate noise level. The higher the bar, the higher the noise.
- The gap between the green and red bars is equivalent to signal to noise ratio.
- A purple bar indicates loss of signal, possibly temporary.
Some configurations, such as ORiNOCO and Prism cards, provide accurate measurements of both signal and noise data, which can be displayed in full with units of dBm.
Other configurations, and in particular any card using the NDIS 5.1 device access method, do not provide noise information, and may provide RSSI instead of signal information. In these cases, NetStumbler may omit the noise display and only display RSSI.
The graph view will automatically scroll to keep up with new data if you are viewing the rightmost part of it.
The data in each column is described in the table below.
| Column | Description |
| MAC |
The text contains the BSSID for wireless devices. The icon shows the signal strength as reported in the last scan: Gray means the item was not detected, or a colored icon ranging from red to green reports the signal strength. A lock appears in the icon if encryption is enabled on the network. For devices on a wired network segment, the icon shows a T-shaped network cable and the MAC address is displayed. |
| SSID | The reported SSID. This may be blank for access points that report their existence but not their SSID. For wired network items, the SSID is assumed to be the SSID that was associated when the item was discovered. |
| Name | The device's name. This is reported rarely and only if "Query APs for names" is configured. |
| Chan | All the channels that the device has been seen on. The most recent one is listed first. Before the channel number may be a star (*), which means you are associated with the device, or a plus (+) which means that you were associated with it at some point. |
| Speed | The maximum reported bandwidth for the device (this is not the actual bandwidth). If you are using an 802.11b device, it may misreport the bandwidth of 802.11g networks as 11Mbps. Some devices are capable of 108Mbps but only report 54Mbps. |
| Vendor | The vendor assigned to the MAC, which may not be the actual equipment manufacturer. |
| Type | "AP" for a BSS, "Peer" for an IBSS. |
| Encryption | The word "WEP" will appear on an encrypted network, regardless of whether it is really using WEP. |
| SNR | The current Signal to Noise ratio, either in dB or arbitrary RSSI units. |
| Signal+ | The highest seen Signal value. |
| Noise- | The lowest seen Noise value. |
| SNR+ | The highest seen SNR value. |
| IP, Subnet | The IP configuration of the object, if available. |
| Latitude, Longitude, Distance | If you are using a GPS receiver, this indicates the estimated position of the object. This position is currently the location where the strongest signal was seen, which is never the actual location. Distance is measured from your current position to the object's estimated position. |
| First Seen | The time or date when the object was first discovered. |
| Last Seen | The most recent time or date when the object was seen. |
| Signal | The current Signal level, either in dB or arbitrary RSSI units. |
| Noise | The current Noise level, in dB. Not supported by all devices. |
| Flags | The 802.11 capability flags, in hexadecimal. |
| Beacon | The 802.11 beacon interval, in Kµs. |


